Pivot tables let you analyze large amounts of data and narrow down large data sets to see the relationships between data points. Google Sheets uses pivot tables to summarize your data, making it easier to understand all the information contained in your spreadsheet.
What Are Pivot Tables?
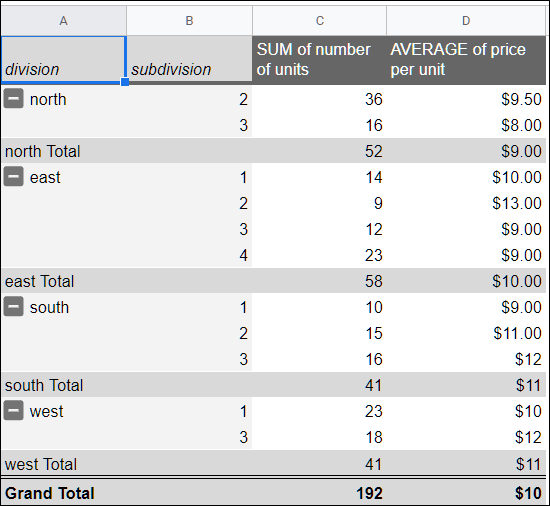
Pivot tables are handy for analyzing massive amounts of data. Where a regular spreadsheet uses only two axes—columns and rows—pivot tables help us make sense of the information in your spreadsheet by summarizing any selected columns and rows of data. For example, a pivot table could be used to analyze sales brought in by divisions of a company for a specific month, where all the information is randomly entered into a dataset.

Creating a pivot table from the information in the picture above displays a neatly formatted table with information from selected columns, sorted by division.
RELATED: The Best Google Sheets Add-Ons
How to Create a Pivot Table
Fire up Chrome and open a spreadsheet in Google Sheets.
Next, select any of the cells you want to use in your pivot table. If you’re going to use everything in your dataset, you can click anywhere on the spreadsheet, you don’t have to select every cell first.
Read the remaining 30 paragraphs
Source : What are Pivot Tables in Google Sheets, and How Do I Use Them